- Barajar
ActivarDesactivar
- Alphabetizar
ActivarDesactivar
- Frente Primero
ActivarDesactivar
- Ambos lados
ActivarDesactivar
- Leer
ActivarDesactivar
Leyendo...
Cómo estudiar sus tarjetas
Teclas de Derecha/Izquierda: Navegar entre tarjetas.tecla derechatecla izquierda
Teclas Arriba/Abajo: Colvea la carta entre frente y dorso.tecla abajotecla arriba
Tecla H: Muestra pista (3er lado).tecla h
Tecla N: Lea el texto en voz.tecla n
![]()
Boton play
![]()
Boton play
![]()
47 Cartas en este set
- Frente
- Atrás
- 3er lado (pista)
|
difference between a map and a figure?
|
coordinates indicating geographical location on the surface of he Earth
|
x and y
|
|
geospatial info stored in databases is __ % of all information
|
>80
|
|
|
limitation of paper based maps (3)
|
Info coded as symbols and colors (qualitative information),
large areas = several map sheets, combination and sharing of info is difficult |
qualitative, scale, static
|
|
Adventages of computer cartography (8)
|
Quicklier(!)
no skilled staff needed (!) cheaper allows experimentation in representation with the same data facilitate updating facilitate analysis of quantitative data generalization on quality of data easier to make (3D maps) |
statistical analysis and mapping
cost, experience, updating, quality defined, better analysis (3D) and experimentation |
|
Reference maps
|
several types of info
summarizes often covers large areas deals with geography of a region (understanding) |
maps in atlases
|
|
Thematic maps
|
detailed information about a topic of particular interest
tailored to particular user needs |
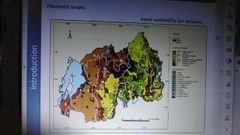
road map, risk map
|
|
GIS IS...
|
integration of
digital geographical information computer technology GIS science (knowledge about integration) |
3 things
|
|
GIS history
|
pioneering (1957)
commercialization (1980) user proliferation (2000) open source (2010) at first restricted (military, government & private companies) recently open to general public |
application, technology and commercial details. academic and general as well
|
|
GIS toolbox definition
|
A geographic information system is a computer-based information system that enlables:
collecting, storing, retrieving, modelling (analysis), and representation of geographically referenced information" |
C - S - R - M (A) - R
|
|
components of GIS (6)
|
network
hardware software data procedures people |
N -> (H, S, D, Procedures and People)
|
|
GIS chain
|
expertise
structured data organization hardware/software |
updating: data, software, knowledge
|
|
Application of GIS
|
government and public services (tracking crime, land use planning, environmental monitoring, geodemographics)
business & service planning (where costumers are, geodem) logistics and transportation (gps) environment |
|
|
GIS is the combination of
|
computer cartography (CC)
database management (DBM) remote sensing (RS) computer-aided design (CAD) |
display and printing
storing and retrieving data information extraction (raster) input, assumed for design (vector) |
|
Land Information System (LIS)
|
GIS with focus on the analysis of _natural land resources_ (soil, water, geology, landscapes, topography, land use, vegetation, climate...) with applications in agriculture, land planning, management of natural ecosystems, environmental management, etc.
|
natural land resources (8 examples)
applications in (4 examples) |
|
REAL WORLD TO GIS
|
RW - conceptual model - logical model - physical model - limitations
|
binary information; tons of information (symbols, proximity, extent)
|
|
data modelling
|
interpreting reality by using a conceptual and logical model
|
RW complex (need to simplify)
|
|
conceptual model
|
human-oriented model of selected entities (basic carriers of information) and processes that are thought relevant to a particular problem
|
real world model (relevant entities and processes)
|
|
logical model
|
oriented representation of reality
entities comprise different objects (physical -roads-, classified -soil types-, events (waterleaks), artificial - elevation contours) |
(data model)
|
|
objects description
|
-identity (identifier -numbers-)
-geometric and attribute data (point/line/area and nominal, interval ratio) -spatial relationships (intersects etc and proximity) -quality (roads) |
|
|
physical model
|
describes the exact files or database table used to store data, the relation between objects and the precise operations that can be performed
|
|
|
building a conceptual model of reality
|
asking what your final product needs to be
break down or decomposed to final product into the general types of maps that you need to use determine which aspects of each map do you need to examine (defines the map elements (features and their data) that ultimately plan to combine to create your file map |
model creation process
|
|
summary
|
-real world (general view -landscape-)
-conceptual model (unique entities -houses-) -data model (entities with attributes -table with basic characteristics) -data base (digital data coding (geography and attributes) -real table-) -map |
RW-CM-DM-DB-MAP
|
|
uncertainty
|
generalizations make possible to obtain an overview of our complex reality
|
generalizations need choices
|
|
DIGITAL SPATIAL INFORMATION
|
the geographical database
basic map concepts data structures |
|
|
digitizing a map (2)
|
digitizing
scanning |
raster or vector based
|
|
geographical database
|
the real world consists of many features, which can be represented as a number of relates single theme data layers with each layer linked to a common georeferencing system
|
layers represent real world
|
|
graphical representation of spatial objects
|
node (arc), vertex (polygon)
vector arc polygon raster (cells) pixels |
vector based mapping
raster based mapping |
|
Traditional paper maps
|
set of points lines areas defined by
-location -legend (attribute information using colours and symbols) -topology (spatial interrelationships) |
3 characteristics
|
|
definition of vector
|
a straight line segment whose length is MAGNITUDE and whose orientation in space is DIRECTION
|
magnitude and direction
|
|
point, arc, polygon are vectors...
|
with zero length,
combinated and connected c,c and closed |
N for node
a for arc P for polygon |
|
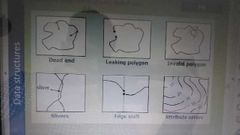
spaghetti data models vs arc node days models
|
topology
|
endpoint nodes, shared nodes,
|
|
usefulness of topology
|
automatic calculations
verification of data consistency analysis |
|
|
object oriented data model
|
combine the characteristics of objects and slept relationships with other objects (states + behavior)
|
more modern than the other two (examples: intersection roads with highways or polygons must not overlap)
|
|
definition of raster
|
"a matrix", a regular grid of squared cells of equal dimensions
-location of each cell determined by idt row & column number -value assigned to the cells represents code of the attribute |
-identifier
-qualitative or -quantitative attribute value |
|
resolution
|
linked to accuracy and data storing capacity
the finer the resolution, the more detail an increase of 2x in resolution is a 4x increase in number of pixels |
|
|
vector vs raster
|
vector (compact, efficient data structure, only boundaries are stored, updating and querying is very efficient and quick)
- aesthetically nicer |
vector adventages
|
|
Raster vs Vector
|
-overlay more efficient
-more analitical power when mathematical operations -required when remote sensing information -spatially continuously varying phenomena (topography, climate, soil, water,air) |
|
|
Summary of adventages and disadvantages (Raster)
|
(A) - Simple data structure,
overlay operations easy and efficient, representation of spatial variability, required when working with images (for efficient enhancement and manipulation) (D) - less compact, topological relationships difficult to represent, output less aesthetically pleasing (due to boundaries with blocky appearance or unacceptable large files) |
squared, overlay, variations, pictures
less compact, topology relations difficult, less aesthetical |
|
Summary of adv and disadv (Vector)
|
(A) - compact structure,
efficient encoding of topology -> easier network analysis, better in representation (output) (D) -complex data structure, more difficult to overlay, high spatial variability representation is inefficient, manipulation and enhancement of digital images not effectively done |
compact data structure, clear topology, nice representation
complex data structure, difficult overlays, HSV inefficient, images |
|
application fields of vector and raster
|
network topology (industry)
large databases (governmental bodies) mapping (commercial applications) analitical power and east concept (research and teaching institutions) |
most modern GIS are hybrid systems
|
|
MAP SCALE AND PROJECTIONS
|
scale
datum ellipsoid projections (distortions) |
|
|
Projection formulas
|
mathematical expressions that convert data from a geographical location on a spheroid to a representative location on flat surface
|
|
|
4 types of distortion
|
shape
areas distances directions |
|
|
Map scale (large or small)
|
more detailed -> large scale
less detailed -> small scale 1/10000 > 1/1000000 |
Detail
|
|
map projections (Earth to map)
|
mathematical conversion between the Earth ellipsoid and a flat paper
-angles measured from the Earth's center point (graticule network), rather than distances on the surface -distance represented by 1° longitude will reduce towards the poles |
°
|
|
types of projections
|
shape (plane, cylinder, cone)
points or lines of contact (cut or touch, no distortion there) orientation (transversal, equatorial) depending on the chosen projection, we can preserve (shape, area, distance along lines, distorts all, but balances) |
3
all can roach |
|
coordinate Systems (3)
|
geographic coordinates (°, origin, length of 1° longitude varies with the latitude, not planar, accuracy of 0.001°)
UTM (m, 60 different projections of 6° width -1st is from 180 to 174°W, subdivision 60S or 60N, local planar systems |
universal transverse Mercator
|